
Contents
- 1 Ohio’s 20 Safest Cities of 2024
- 1.1 Here are the 10 safest cities in Ohio for 2024
- 1.2 In this report
- 1.3 2024 Ohio crime rates
- 1.4 Property crime in Ohio: Fear vs. reality
- 1.5 Which security measures are used the most in Ohio?
- 1.6 How to stay safe in Ohio
- 1.7 What crimes are Ohio residents most concerned about?
- 1.8 Violent crime in Ohio: Fear vs. reality
- 1.9 A closer look at the safest cities in Ohio
- 1.10 The 20 safest cities in Ohio
- 1.11 How we determined the safest cities
- 1.12 How to make a safe home anywhere
- 1.13 Find the safest cities in each state
- 1.14 Related articles on SafeWise
- 1.15 Recent Articles
Ohio’s 20 Safest Cities of 2024
Alina Bradford
Apr 08, 2024
![]() 2 min read
2 min read

Here are the 10 safest cities in Ohio for 2024
- Broadview Heights
- New Philadelphia
- Hamilton Township, Warren County
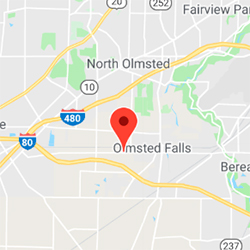
- Olmsted Township
- Montville Township
- Bay Village
- Willowick
- Brecksville
- Parma Heights
- Hudson

See crime rates for the safest cities.
In our latest State of Safety survey, 45% of respondents in Ohio reported concern for their safety. This is about the same as the national average of 47%.
This is surprising since the state falls below national averages for both violent crime and property crime. Property crime did increase year over year, and violent crime rose by just 0.3 incidents per 1,000 residents. Ohio’s 20 safest cities saw only a fraction of the state rates for both crime categories.
In this report
- Property crime rates
- Violent crime rates
- Interesting findings
- The Safest Cities
- Methodology
- How to make a safe home anywhere
- How other cities compare
- How other states compare


Download the full list of cities in your stateEnter your email to get the full list with crime stats.
By signing up, you agree to our Terms and Conditions and Privacy Policy.
NOTE: If your city is missing from our full report, it means that it was below the population threshold or didn’t submit a complete crime report to the FBI in 2022.
2024 Ohio crime rates
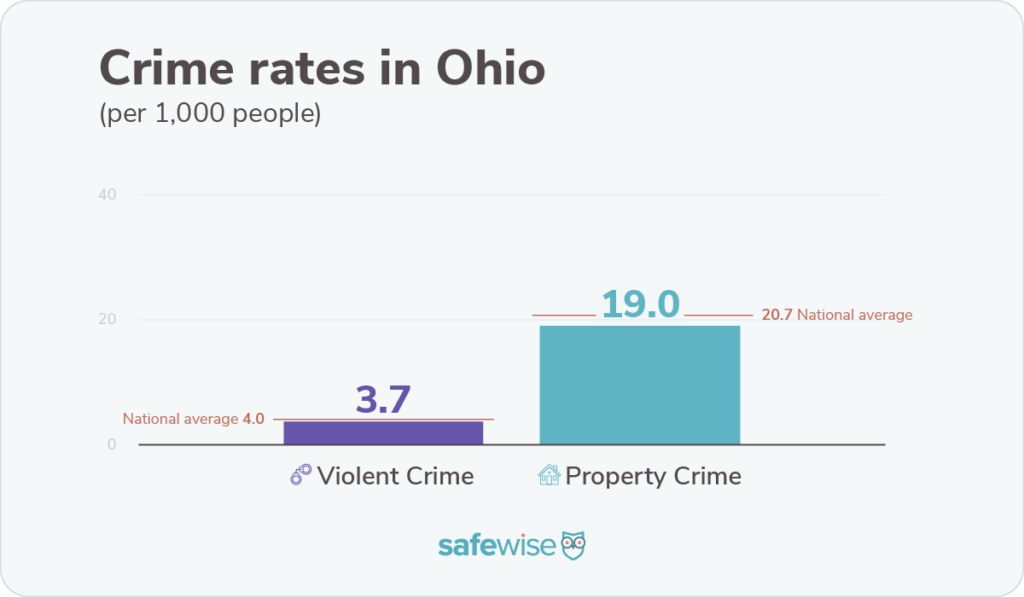
Image: SafeWise
Although Ohio’s violent crime rate is relatively low compared to most states, it had a small increase from 3.4 violent crimes per 1,000 people to 3.7 this year. The state’s property crime rate went from 18.5 per 1,000 people to 19.0
Property crime in Ohio: Fear vs. reality
There was no increase in personal encounters with property crime in Ohio this year. There was also a large decrease in experiences with package theft, falling 20%.
- 29% of Ohio residents told us they personally experienced property crime this year (US 27%).
- Larceny theft accounts for 86% of all property crimes in The Buckeye State (US 72%).
- 28% of respondents reported experiencing package theft—almost matching the US average (35%).
- 34% of people in Ohio use no form of property protection. This is substantially higher than the 25% national average.
- The most popular form of property protection is security cameras (37%).
- 29% of respondents say that they have increased the safety or security of their property.
Which security measures are used the most in Ohio?
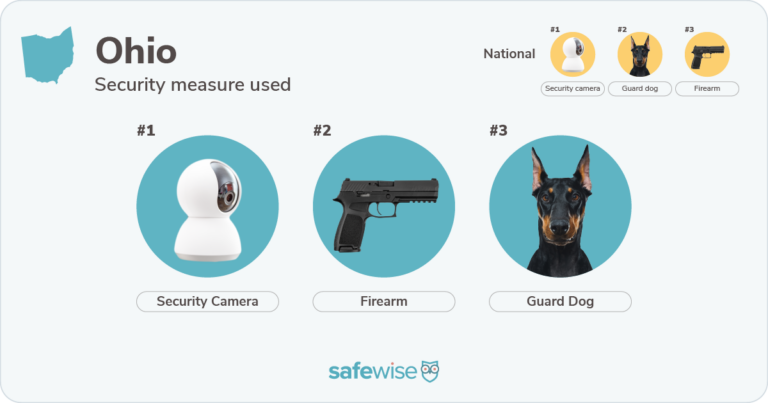
Image: SafeWise
How to stay safe in Ohio
Ohio sees 5% more burglaries than the nationwide average.
Protect your property

Vivint Home Security

4.5
View Packages
Ohio survey respondents named gun violence their top safety concern.
Secure your firearms
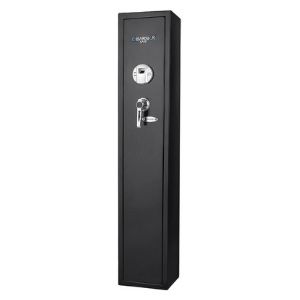
Barska Biometric Rifle Safe

4
View on Amazon
What crimes are Ohio residents most concerned about?
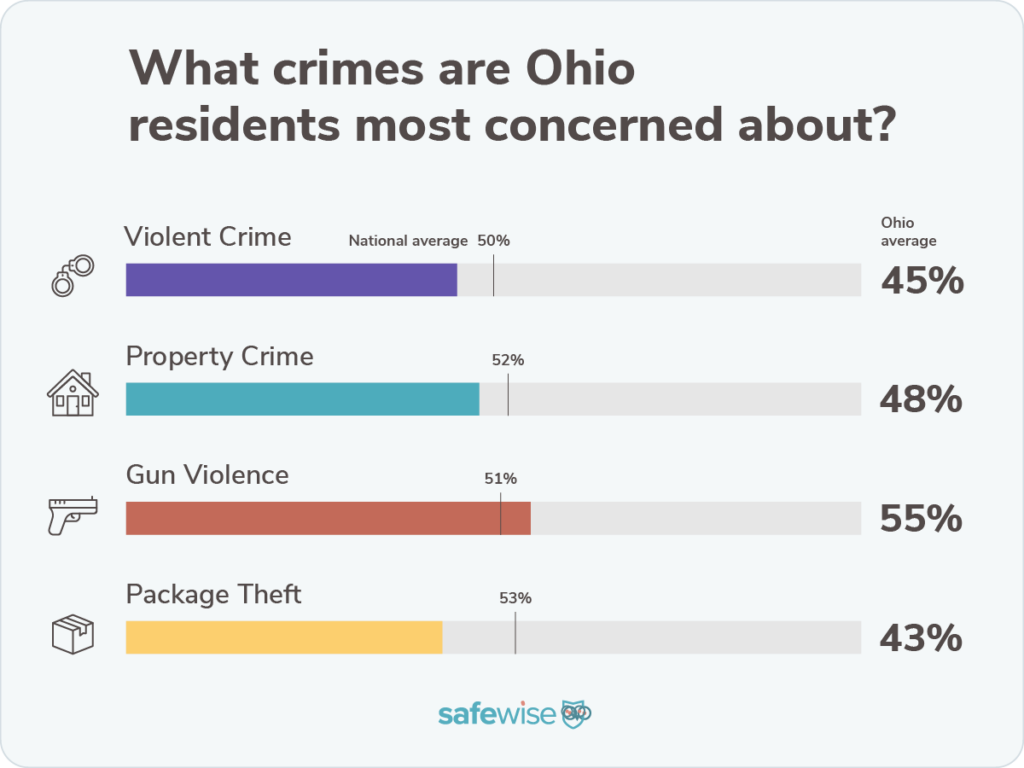
Image: SafeWise
Violent crime in Ohio: Fear vs. reality
People in Ohio tend to feel slightly less safe in their home state than the average American. This is surprising since the respondents reported experiencing less violent crime.
- 44% of people in Ohio reported feeling safe in their state compared to 45% of Americans.
- 11% of Ohio respondents reported having a personal experience with violent crime in the 12 months prior to the survey (US 15%). That’s down 48% from the year before.
- Murder is the least common violent crime in The Buckeye State, making up 2% of violent crimes (US 2%).
- 34% of survey participants report using some form of personal protection like pepper spray—almost the same as the US average (36%).
- The most common form of protection (59%) was concealed firearms.
Attitudes about gun violence in Ohio
- 55% of Ohio residents named gun violence as a safety concern—well above the US average of 51%.
- 13% of survey respondents reported experiencing gun violence in the 12 months prior to the survey—higher than the national average of 12%.
- There were 33 mass shootings in Ohio. This number increased this year by 73.7%.
A closer look at the safest cities in Ohio
For the purposes of this report, the terms “dangerous” and “safest” refer explicitly to crime rates as calculated from FBI crime data—no other characterization of any community is implied or intended.
- 165 cities qualified for our safest cities list this year.
- All 22 of the top safest cities reported zero murders. In fact, most cities on the list reported zero murders.
- Broadview Heights is new to our list this year and blasted to the #1 spot.
- Olmsted Township, our #1 spot last year, Broadview Heights, and Bay Village reported zero murders, rapes and robberies.
- Five safest cities reported zero motor vehicle thefts.
- Brecksville was the only city that reported just one burglary.
- All of the top 10 safest cities reported less than 100 property crimes each. Many of them reported less than 60.
- Violent crime was 50% lower in the safest cities than the state average.
The 20 safest cities in Ohio
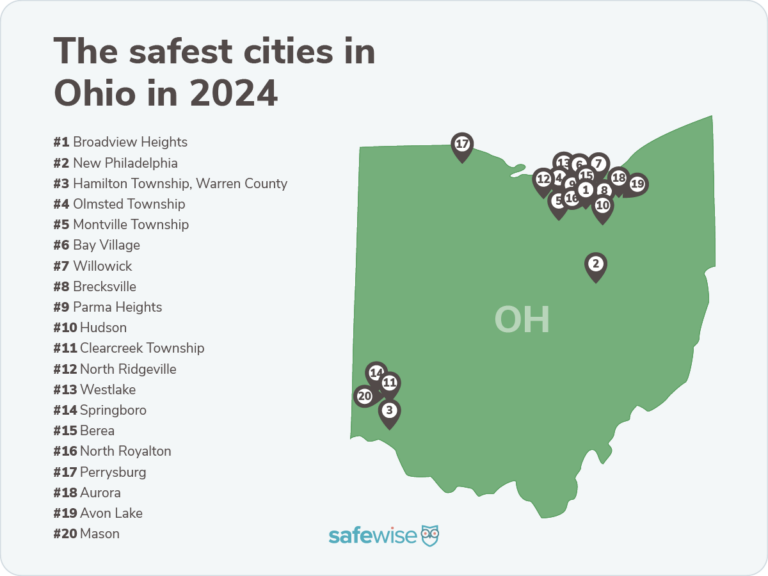
Image: SafeWise
 #1Broadview Heights(New)
-
 Population19,490
 -
 VC Rate 2024, 2023, 20220.1, N/A, 0.1
 -
 PC Rate 2024, 2023, 20221.4, N/A, 1.0
 -
 VC=Violent crime, PC=Property crime
 #2New Philadelphia(-0-)
-
Population17,508
-
VC Rate 2024, 2023, 20220.2, 0.1, 0.4
-
PC Rate 2024, 2023, 20221.1, 1.1, 6.0
-
VC=Violent crime, PC=Property crime
 #3Hamilton Township, Warren County(+2
![]() )
)
-
Population27,421
-
VC Rate 2024, 2023, 20220.3, 0.3, N/A
-
PC Rate 2024, 2023, 20222.9, 2.3, N/A
-
VC=Violent crime, PC=Property crime
 #4Olmsted Township(-3
![]() )
)
-
Population14,486
-
VC Rate 2024, 2023, 20220.2, 0.0, 0.0
-
PC Rate 2024, 2023, 20223.2, 1.0, 2.7
-
VC=Violent crime, PC=Property crime
 #5Montville Township(New)
-
Population13,304
-
VC Rate 2024, 2023, 20220.2, N/A, 0.3
-
PC Rate 2024, 2023, 20223.5, N/A, 5.0
-
VC=Violent crime, PC=Property crime
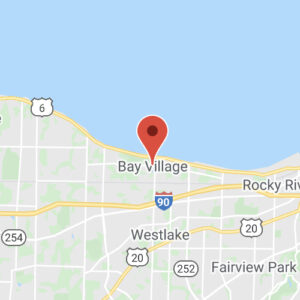 #6Bay Village(+7
![]() )
)
-
Population15,826
-
VC Rate 2024, 2023, 20220.4, 0.3, 0.4
-
PC Rate 2024, 2023, 20223.0, 4.9, 8.3
-
VC=Violent crime, PC=Property crime
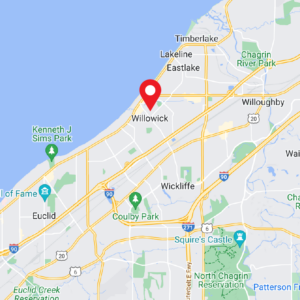 #7Willowick(New)
-
Population14,103
-
VC Rate 2024, 2023, 20220.5, N/A, N/A
-
PC Rate 2024, 2023, 20222.8, N/A, N/A
-
VC=Violent crime, PC=Property crime
 #8Brecksville(-5
![]() )
)
-
Population13,466
-
VC Rate 2024, 2023, 20220.3, 0.1, 0.1
-
PC Rate 2024, 2023, 20223.7, 1.7, 4.2
-
VC=Violent crime, PC=Property crime
 #9Parma Heights(-2
![]() )
)
-
Population20,306
-
VC Rate 2024, 2023, 20220.2, 0.2, N/A
-
PC Rate 2024, 2023, 20223.9, 3.7, N/A
-
VC=Violent crime, PC=Property crime
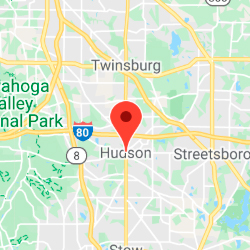 #10Hudson(+6
![]() )
)
-
Population22,902
-
VC Rate 2024, 2023, 20220.3, 0.2, 0.2
-
PC Rate 2024, 2023, 20224.2, 5.8, 6.6
-
VC=Violent crime, PC=Property crime
 #11Clearcreek Township(-7
![]() )
)
-
Population19,152
-
VC Rate 2024, 2023, 20220.5, 0.0, 0.1
-
PC Rate 2024, 2023, 20223.7, 2.3, 2.0
-
VC=Violent crime, PC=Property crime
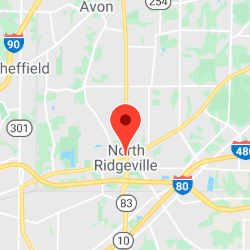 #12North Ridgeville(New)
-
Population36,968
-
VC Rate 2024, 2023, 20220.4, N/A, N/A
-
PC Rate 2024, 2023, 20224.5, N/A, N/A
-
VC=Violent crime, PC=Property crime
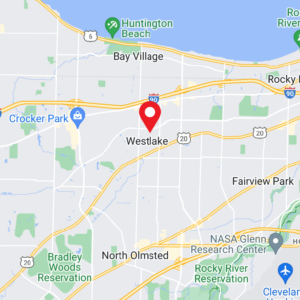 #13Westlake(New)
-
Population33,734
-
VC Rate 2024, 2023, 20220.4, N/A, N/A
-
PC Rate 2024, 2023, 20224.4, N/A, N/A
-
VC=Violent crime, PC=Property crime
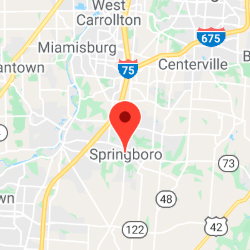 #14Springboro(-8
![]() )
)
-
Population19,431
-
VC Rate 2024, 2023, 20220.3, 0.2, N/A
-
PC Rate 2024, 2023, 20224.9, 3.7, N/A
-
VC=Violent crime, PC=Property crime
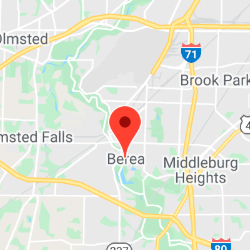 #15Berea(-7
![]() )
)
-
Population18,736
-
VC Rate 2024, 2023, 20220.4, 0.3, 1.3
-
PC Rate 2024, 2023, 20225.2, 3.9, 7.6
-
VC=Violent crime, PC=Property crime
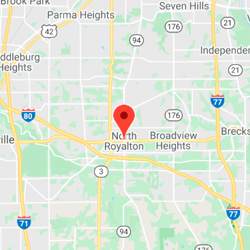 #16North Royalton(New)
-
Population30,687
-
VC Rate 2024, 2023, 20220.4, N/A, 0.4
-
PC Rate 2024, 2023, 20225.2, N/A, 5.2
-
VC=Violent crime, PC=Property crime
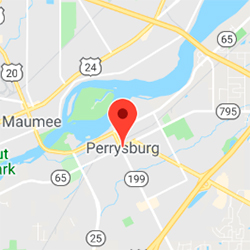 #17Perrysburg(+13
![]() )
)
-
Population25,165
-
VC Rate 2024, 2023, 20220.2, 0.6, 0.6
-
PC Rate 2024, 2023, 20226.2, 8.0, 8.3
-
VC=Violent crime, PC=Property crime
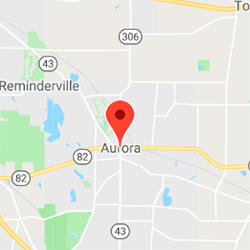 #18Aurora(+3
![]() )
)
-
Population17,486
-
VC Rate 2024, 2023, 20220.3, 0.3, 0.3
-
PC Rate 2024, 2023, 20225.7, 7.2, 7.1
-
VC=Violent crime, PC=Property crime
 #19Avon Lake(-10
![]() )
)
-
Population25,846
-
VC Rate 2024, 2023, 20220.7, 0.4, 0.2
-
PC Rate 2024, 2023, 20224.4, 4.0, 2.1
-
VC=Violent crime, PC=Property crime
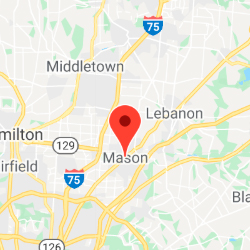 #20Mason(-10
![]() )
)
-
Population35,344
-
VC Rate 2024, 2023, 20220.1, 0.1, N/A
-
PC Rate 2024, 2023, 20226.5, 5.1, N/A
-
VC=Violent crime, PC=Property crime
How we determined the safest cities
Learn how we identified the safest cities on our methodology page.
How to make a safe home anywhere
Over 6 in 10 Americans surveyed don’t have a home security system, despite over 50% of all burglaries being residential. Unfortunately, a majority of people who have a security system added it after they had a break-in. One of the best ways to stop a burglary before it happens—and get immediate help if a break-in is detected—is to add a monitored home security system.
![]() Get a home security system
Get a home security system
Find out which companies we recommend for every budget and lifestyle in our roundup of the Best Home Security Systems—and learn the basics with our guide on Everything You Need to Know About Home Security.
Find security and safety resources in your area
Alabama
Alaska
Arizona
Arkansas
California
Colorado
Connecticut
Delaware
Florida
Georgia
Hawaii
Idaho
Illinois
Indiana
Iowa
Kansas
Kentucky
Louisiana
Maine
Maryland
Massachusetts
Michigan
Minnesota
Mississippi
Missouri
Montana
Nebraska
Nevada
New Hampshire
New Jersey
New Mexico
New York
North Carolina
North Dakota
Ohio
Oklahoma
Oregon
Pennsylvania
Rhode Island
South Carolina
South Dakota
Tennessee
Texas
Utah
Vermont
Virginia
Washington
West Virginia
Wisconsin
Wyoming
Find the safest cities in each state
Click on the state below to check out the safest cities for each state.
var simplemaps_usmap_mapdata = {“main_settings”:{“width”:”responsive”,”background_color”:”#ffffff”,”background_transparent”:”yes”,”label_color”:”#FFFFFF”,”label_font”:”Arial”,”hide_labels”:”no”,”border_color”:”#FFFFFF”,”state_description”:”State description”,”state_color”:”#A6D5DE”,”state_hover_color”:”#AE4332″,”state_url”:”https:\/\/www.safewise.com”,”all_states_inactive”:”no”,”location_description”:”Location description”,”location_color”:”#FF0067″,”location_opacity”:”0.8″,”location_url”:”https:\/\/www.safewise.com”,”location_size”:”25″,”location_type”:”circle”,”all_locations_inactive”:”no”,”url_new_tab”:”no”,”div”:”map_3bcfdf24″,”arrow_color_border”:”#88A4BC”,”border_size”:”1.5″,”pop_ups”:”off”,”popup_color”:”white”,”popup_opacity”:”0.9″,”popup_shadow”:”1″,”popup_corners”:”5″,”popup_font”:”12px\/1.5 Verdana, Arial, Helvetica, sans-serif”,”popup_nocss”:”no”,”initial_zoom”:”-1″,”initial_zoom_solo”:”no”,”all_states_zoomable”:”no”,”auto_load”:”no”,”zoom”:”yes”,”js_hooks”:”no”,”all_states_hidden”:”no”,”popups”:null},”state_specific”:{“AK”:{“name”:”Alaska”,”color”:”default”,”hover_color”:”default”,”url”:”\/blog\/safest-cities-alaska\/”,”hide”:”default”,”inactive”:”default”,”zoomable”:”default”,”description”:null},”AL”:{“name”:”Alabama”,”color”:”default”,”hover_color”:”default”,”url”:”\/state-of-safety\/al\/”,”hide”:”default”,”inactive”:”default”,”zoomable”:”default”,”description”:null},”AR”:{“name”:”Arkansas”,”color”:”default”,”hover_color”:”default”,”url”:”\/blog\/safest-cities-arkansas\/”,”hide”:”default”,”inactive”:”default”,”zoomable”:”default”,”description”:null},”AZ”:{“name”:”Arizona”,”color”:”default”,”hover_color”:”default”,”url”:”\/blog\/safest-cities-arizona\/”,”hide”:”default”,”inactive”:”default”,”zoomable”:”default”,”description”:null},”CA”:{“name”:”California”,”color”:”default”,”hover_color”:”default”,”url”:”\/blog\/safest-cities-california\/”,”hide”:”default”,”inactive”:”default”,”zoomable”:”default”,”description”:null},”CO”:{“name”:”Colorado”,”color”:”default”,”hover_color”:”default”,”url”:”\/blog\/safest-cities-colorado\/”,”hide”:”default”,”inactive”:”default”,”zoomable”:”default”,”description”:null},”CT”:{“name”:”Connecticut”,”color”:”default”,”hover_color”:”default”,”url”:”\/blog\/safest-cities-connecticut\/”,”hide”:”default”,”inactive”:”default”,”zoomable”:”default”,”description”:null},”DE”:{“name”:”Delaware”,”color”:”default”,”hover_color”:”default”,”url”:”\/blog\/safest-cities-delaware\/”,”hide”:”default”,”inactive”:”default”,”zoomable”:”default”,”description”:null},”FL”:{“name”:”Florida”,”color”:”default”,”hover_color”:”default”,”url”:”\/blog\/safest-cities-florida\/”,”hide”:”default”,”inactive”:”default”,”zoomable”:”default”,”description”:null},”GA”:{“name”:”Georgia”,”color”:”default”,”hover_color”:”default”,”url”:”\/blog\/safest-cities-georgia\/”,”hide”:”default”,”inactive”:”default”,”zoomable”:”default”,”description”:null},”HI”:{“name”:”Hawaii”,”color”:”default”,”hover_color”:”default”,”url”:”\/state-of-safety\/hi\/”,”hide”:”default”,”inactive”:”default”,”zoomable”:”default”,”description”:null},”IA”:{“name”:”Iowa”,”color”:”default”,”hover_color”:”default”,”url”:”\/state-of-safety\/ia\/”,”hide”:”default”,”inactive”:”default”,”zoomable”:”default”,”description”:null},”ID”:{“name”:”Idaho”,”color”:”default”,”hover_color”:”default”,”url”:”\/blog\/safest-cities-idaho\/”,”hide”:”default”,”inactive”:”default”,”zoomable”:”default”,”description”:null},”IL”:{“name”:”Illinois”,”color”:”default”,”hover_color”:”default”,”url”:”\/blog\/safest-cities-illinois\/”,”hide”:”default”,”inactive”:”default”,”zoomable”:”default”,”description”:null},”IN”:{“name”:”Indiana”,”color”:”default”,”hover_color”:”default”,”url”:”\/blog\/safest-cities-indiana\/”,”hide”:”default”,”inactive”:”default”,”zoomable”:”default”,”description”:null},”KS”:{“name”:”Kansas”,”color”:”default”,”hover_color”:”default”,”url”:”\/blog\/safest-cities-kansas\/”,”hide”:”default”,”inactive”:”default”,”zoomable”:”default”,”description”:null},”KY”:{“name”:”Kentucky”,”color”:”default”,”hover_color”:”default”,”url”:”\/blog\/safest-cities-kentucky\/”,”hide”:”default”,”inactive”:”default”,”zoomable”:”default”,”description”:null},”LA”:{“name”:”Louisiana”,”color”:”default”,”hover_color”:”default”,”url”:”\/blog\/safest-cities-louisiana\/”,”hide”:”default”,”inactive”:”default”,”zoomable”:”default”,”description”:null},”MA”:{“name”:”Massachusetts”,”color”:”default”,”hover_color”:”default”,”url”:”\/blog\/safest-cities-massachusetts\/”,”hide”:”default”,”inactive”:”default”,”zoomable”:”default”,”description”:null},”MD”:{“name”:”Maryland”,”color”:”default”,”hover_color”:”default”,”url”:”\/blog\/safest-cities-maryland\/”,”hide”:”default”,”inactive”:”default”,”zoomable”:”default”,”description”:null},”ME”:{“name”:”Maine”,”color”:”default”,”hover_color”:”default”,”url”:”\/blog\/safest-cities-maine\/”,”hide”:”default”,”inactive”:”default”,”zoomable”:”default”,”description”:null},”MI”:{“name”:”Michigan”,”color”:”default”,”hover_color”:”default”,”url”:”\/blog\/safest-cities-michigan\/”,”hide”:”default”,”inactive”:”default”,”zoomable”:”default”,”description”:null},”MN”:{“name”:”Minnesota”,”color”:”default”,”hover_color”:”default”,”url”:”\/blog\/safest-cities-minnesota\/”,”hide”:”default”,”inactive”:”default”,”zoomable”:”default”,”description”:null},”MO”:{“name”:”Missouri”,”color”:”default”,”hover_color”:”default”,”url”:”\/blog\/safest-cities-missouri\/”,”hide”:”default”,”inactive”:”default”,”zoomable”:”default”,”description”:null},”MS”:{“name”:”Mississippi”,”color”:”default”,”hover_color”:”default”,”url”:”\/blog\/safest-cities-mississippi\/”,”hide”:”default”,”inactive”:”default”,”zoomable”:”default”,”description”:null},”MT”:{“name”:”Montana”,”color”:”default”,”hover_color”:”default”,”url”:”\/blog\/safest-cities-montana\/”,”hide”:”default”,”inactive”:”default”,”zoomable”:”default”,”description”:null},”NC”:{“name”:”North Carolina”,”color”:”default”,”hover_color”:”default”,”url”:”\/blog\/safest-cities-north-carolina\/”,”hide”:”default”,”inactive”:”default”,”zoomable”:”default”,”description”:null},”ND”:{“name”:”North Dakota”,”color”:”default”,”hover_color”:”default”,”url”:”\/blog\/safest-cities-north-dakota\/”,”hide”:”default”,”inactive”:”default”,”zoomable”:”default”,”description”:null},”NE”:{“name”:”Nebraska”,”color”:”default”,”hover_color”:”default”,”url”:”\/blog\/safest-cities-nebraska\/”,”hide”:”default”,”inactive”:”default”,”zoomable”:”default”,”description”:null},”NH”:{“name”:”New Hampshire”,”color”:”default”,”hover_color”:”default”,”url”:”\/blog\/safest-cities-new-hampshire\/”,”hide”:”default”,”inactive”:”default”,”zoomable”:”default”,”description”:null},”NJ”:{“name”:”New Jersey”,”color”:”default”,”hover_color”:”default”,”url”:”\/blog\/safest-cities-new-jersey\/”,”hide”:”default”,”inactive”:”default”,”zoomable”:”default”,”description”:null},”NM”:{“name”:”New Mexico”,”color”:”default”,”hover_color”:”default”,”url”:”\/blog\/safest-cities-new-mexico\/”,”hide”:”default”,”inactive”:”default”,”zoomable”:”default”,”description”:null},”NV”:{“name”:”Nevada”,”color”:”default”,”hover_color”:”default”,”url”:”\/blog\/safest-cities-nevada\/”,”hide”:”default”,”inactive”:”default”,”zoomable”:”default”,”description”:null},”NY”:{“name”:”New York”,”color”:”default”,”hover_color”:”default”,”url”:”\/blog\/safest-cities-new-york\/”,”hide”:”default”,”inactive”:”default”,”zoomable”:”default”,”description”:null},”OH”:{“name”:”Ohio”,”color”:”default”,”hover_color”:”default”,”url”:”\/blog\/safest-cities-ohio\/”,”hide”:”default”,”inactive”:”default”,”zoomable”:”default”,”description”:null},”OK”:{“name”:”Oklahoma”,”color”:”default”,”hover_color”:”default”,”url”:”\/blog\/safest-cities-oklahoma\/”,”hide”:”default”,”inactive”:”default”,”zoomable”:”default”,”description”:null},”OR”:{“name”:”Oregon”,”color”:”default”,”hover_color”:”default”,”url”:”\/blog\/safest-cities-oregon\/”,”hide”:”default”,”inactive”:”default”,”zoomable”:”default”,”description”:null},”PA”:{“name”:”Pennsylvania”,”color”:”default”,”hover_color”:”default”,”url”:”\/blog\/safest-cities-pennsylvania\/”,”hide”:”default”,”inactive”:”default”,”zoomable”:”default”,”description”:null},”RI”:{“name”:”Rhode Island”,”color”:”default”,”hover_color”:”default”,”url”:”\/blog\/safest-cities-rhode-island\/”,”hide”:”default”,”inactive”:”default”,”zoomable”:”default”,”description”:null},”SC”:{“name”:”South Carolina”,”color”:”default”,”hover_color”:”default”,”url”:”\/blog\/safest-cities-south-carolina\/”,”hide”:”default”,”inactive”:”default”,”zoomable”:”default”,”description”:null},”SD”:{“name”:”South Dakota”,”color”:”default”,”hover_color”:”default”,”url”:”\/blog\/safest-cities-south-dakota\/”,”hide”:”default”,”inactive”:”default”,”zoomable”:”default”,”description”:null},”TN”:{“name”:”Tennessee”,”color”:”default”,”hover_color”:”default”,”url”:”\/blog\/safest-cities-tennessee\/”,”hide”:”default”,”inactive”:”default”,”zoomable”:”default”,”description”:null},”TX”:{“name”:”Texas”,”color”:”default”,”hover_color”:”default”,”url”:”\/blog\/safest-cities-texas\/”,”hide”:”default”,”inactive”:”default”,”zoomable”:”default”,”description”:null},”UT”:{“name”:”Utah”,”color”:”default”,”hover_color”:”default”,”url”:”\/blog\/safest-cities-utah\/”,”hide”:”default”,”inactive”:”default”,”zoomable”:”default”,”description”:null},”VA”:{“name”:”Virginia”,”color”:”default”,”hover_color”:”default”,”url”:”\/blog\/safest-cities-virginia\/”,”hide”:”default”,”inactive”:”default”,”zoomable”:”default”,”description”:null},”VT”:{“name”:”Vermont”,”color”:”default”,”hover_color”:”default”,”url”:”\/blog\/safest-cities-vermont\/”,”hide”:”default”,”inactive”:”default”,”zoomable”:”default”,”description”:null},”WA”:{“name”:”Washington”,”color”:”default”,”hover_color”:”default”,”url”:”\/blog\/safest-cities-washington\/”,”hide”:”default”,”inactive”:”default”,”zoomable”:”default”,”description”:null},”WI”:{“name”:”Wisconsin”,”color”:”default”,”hover_color”:”default”,”url”:”\/blog\/safest-cities-wisconsin\/”,”hide”:”default”,”inactive”:”default”,”zoomable”:”default”,”description”:null},”WV”:{“name”:”West Virginia”,”color”:”default”,”hover_color”:”default”,”url”:”\/blog\/safest-cities-west-virginia\/”,”hide”:”default”,”inactive”:”default”,”zoomable”:”default”,”description”:null},”WY”:{“name”:”Wyoming”,”color”:”default”,”hover_color”:”default”,”url”:”\/blog\/safest-cities-wyoming\/”,”hide”:”default”,”inactive”:”default”,”zoomable”:”default”,”description”:null}},”locations”:[]};simplemaps_usmap();
Select a state
AlaskaAlabamaArkansasArizonaCaliforniaColoradoConnecticutDelawareFloridaGeorgiaHawaiiIowaIdahoIllinoisIndianaKansasKentuckyLouisianaMassachusettsMarylandMaineMichiganMinnesotaMissouriMississippiMontanaNorth CarolinaNorth DakotaNebraskaNew HampshireNew JerseyNew MexicoNevadaNew YorkOhioOklahomaOregonPennsylvaniaRhode IslandSouth CarolinaSouth DakotaTennesseeTexasUtahVirginiaVermontWashingtonWisconsinWest VirginiaWyoming
Find my state
Related articles on SafeWise
- Best Home Security Systems
- Best Home Security Cameras
- Best Video Doorbell Cameras
- Burglary Stats & Facts
- Over 50% Of All Burglaries Are Residential—How To Protect Your Family
- The Best Personal Safety Devices for Every Situation
Endnotes and sources
Find all endnotes and sources in our full methodology.
FBI Crime Data Explorer, “Documents & Downloads.” Accessed March 18, 2024.
- 2022 and 2021 Crime in the United States Annual Reports
- Offenses Known to Law Enforcement
- 2022 NIBRS Estimation Tables
Bureau of Justice Statistics, “National Incident-Based Reporting System (NIBRS).” Accessed March 18, 2024.
Gun Violence Archive, “Mass Shootings.” Accessed March 18, 2023.
SafeWise experts have years of firsthand experience testing the products we recommend. Learn how we test and review.
Share Article
![]()
![]()
![]()
![]()
![]()
Written by
Alina Bradford
Alina is a safety and security expert that has contributed her insights to CNET, CBS, Digital Trends, MTV, Top Ten Reviews, and many others. Her goal is to make safety and security gadgets less mystifying one article at a time. In the early 2000s, Alina worked as a volunteer firefighter, earning her first responder certification and paving the way to her current career.
Her activities aren’t nearly as dangerous today. Her hobbies include fixing up her 100-year-old house, doing artsy stuff, and going to the lake with her family.
Read More
![]()
Recent Articles

By Cathy Habas
03/27/2024
Best Medical Alert Systems
See which medical alert system is the best to keep you and your loved one…

By John Carlsen
03/20/2024
The Best Home Security Systems in Canada
Find the best home alarm system to protect your house. We looked at price, features,…

By Rebecca Edwards
03/18/2024
Best Home Security Systems
After thousands of hours of tests and research, we picked Vivint and SimpliSafe as the…

By Cathy Habas
03/18/2024
Best Apartment Security Systems
These renter-friendly apartment security systems help keep you safe and require less commitment than your…


